
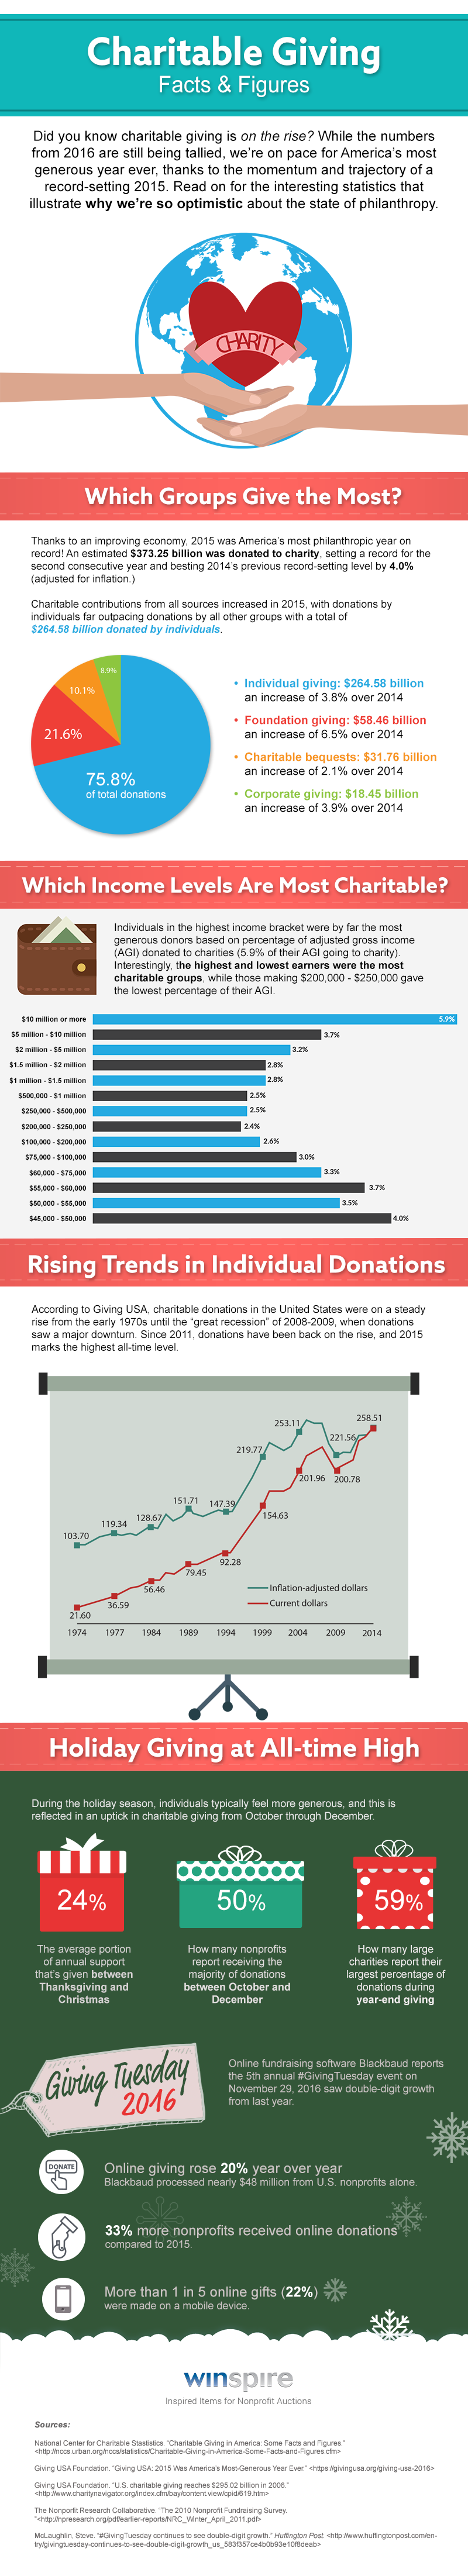
Did you know charitable giving is at an all-time high?
With ever-increasing revenue goals and more need than ever, this may seem hard to believe. But there’s plenty of reason to be optimistic about the state of giving as we look to 2017.
Take #GivingTuesday 2016, for example. Online fundraising software provider Blackbaud reports a year-over-year growth of 20 percent! Any area of fundraising with double-digit growth, particularly in online and mobile donations, merits a closer look.
And while the final numbers from 2016 are still being tallied – with the two most important giving weeks of the year ahead – the momentum and record-breaking trajectory of 2015 successfully set the pace for another groundbreaking year.
Check out today’s post for an infographic detailing positive trends in charitable giving.
(Also note: Limited spots remain for next week’s webinar on improving auction timelines. If you haven’t saved your spot, click here to register in seconds. Then invite committee members, auction chairs, volunteers, board members and more to sign up for what’s sure to be a lively session!)
We hope this infographic encourages you to leave no stone unturned as you pursue fundraising goals.
How have your fundraising results changed in 2016? What strategies do you hope to try in 2017? Let us know in the comments below!
And to supercharge your results from fundraising events, you won’t want to miss a single session in this 3-part webinar series.
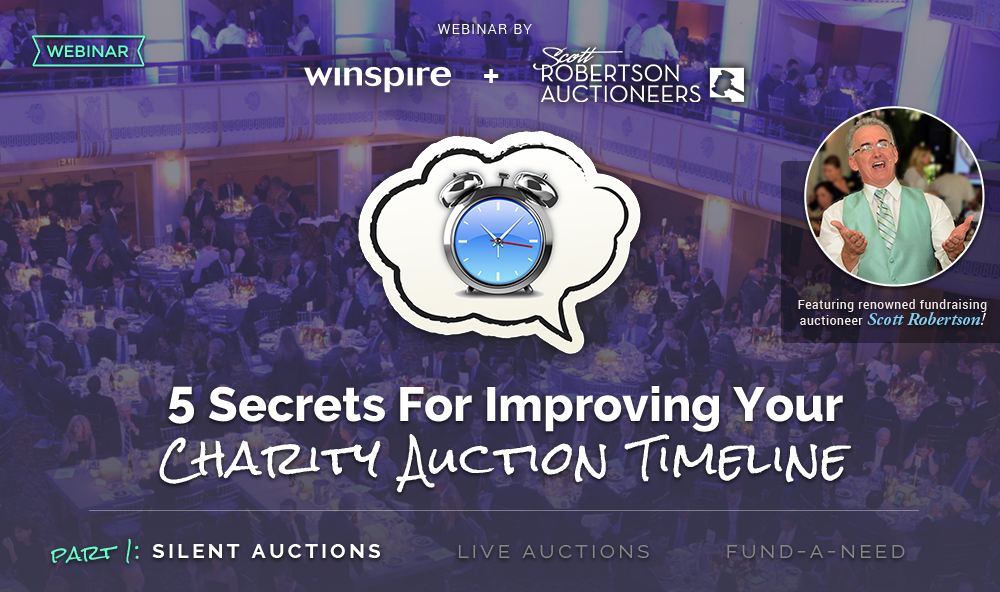
5 Secrets for Improving Your Charity Auction Timeline
Part 1: Silent Auctions
Tuesday, December 20 at 10am PT / 1pm ET
{{cta(‘3cfc1391-33d4-425d-a63f-39d2e0c7febc’,’justifycenter’)}}
Can’t make it? Register anyway and we’ll send you a recording of the webinar shortly after it’s over!